Net Assets
Consolidated balance sheet structure
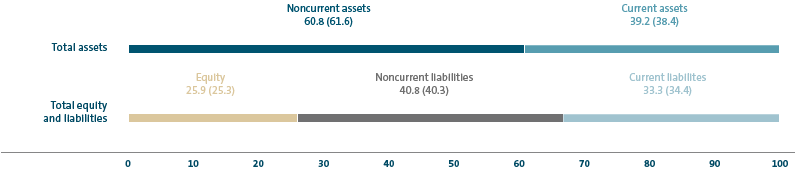
At the end of fiscal year 2020, the Volkswagen Group had total assets of €497.1 billion, 1.9% more than at the end of the prior year. The rise is mostly attributable to the boost in gross liquidity and the successful issue of hybrid notes in the second quarter of 2020. It was offset by exchange rate effects. A chart showing the structure of the consolidated balance sheet as of the reporting date can be found in this chapter. The Volkswagen Group’s equity increased by €5.1 billion to €128.8 billion. The equity ratio was 25.9 (25.3)%.
As of the end of fiscal year 2020, the Group had off-balance-sheet commitments in the form of contingent liabilities in the amount of €8.6 (8.5) billion and in the form of financial guarantees in the amount of €0.4 (0.4) billion. In addition, there were other financial obligations of €22.0 billion, which exceeded the prior-year figure of €20.0 billion. The contingent liabilities relate primarily to legal risks in connection with the diesel issue, as well as to potential liabilities from tax risks in the Commercial Vehicles Business Area in Brazil. Other financial obligations primarily result from purchase commitments for property, plant and equipment and irrevocable credit commitments to customers. They also include commitments to invest in the infrastructure for zero-emission vehicles and in initiatives to promote access to and awareness of this technology. These commitments were made as part of the settlement agreements in the USA in connection with the diesel issue. The other financial obligations include an amount of €0.9 billion for this purpose. In addition, this item reflects the payment of the purchase price for the acquisition of all of Navistar’s outstanding shares totaling around USD 3.7 billion, as the merger agreement between TRATON and Navistar contains conditions precedent and the purchase price payment cannot be recorded as a liability in the balance sheet at present.
CONSOLIDATED BALANCE SHEET STRUCTURE 2020
in percent
Automotive Division balance sheet structure
As of December 31, 2020, the Automotive Division’s intangible assets increased slightly compared with fiscal year 2019, driven among other factors by a rise in capitalized development costs. Property, plant and equipment declined due to exchange rate factors and depreciation in excess of additions. Equity-accounted investments were up as the year-on-year decline in the business results of the Chinese joint ventures was offset by resolutions to pay lower dividends and by additions to the interests held in entities such as Argo AI, QuantumScape, Anhui Jianghuai Automobile Group Holdings and Northvolt. Noncurrent other receivables and financial assets increased. Total noncurrent assets were up €3.1 billion to €156.9 billion.
Current assets were higher than at the end of 2019, amounting to €97.2 (93.1) billion. As a result of downscaled production in response to the pandemic and due to exchange rate effects, the inventories included in this item were lower. The Automotive Division’s securities and cash and cash equivalents rose by €8.5 billion to €41.7 billion.
In the previous year, the “Assets held for sale” item included the carrying amounts of assets to be derecognized as a result of the contribution of AID to the Argo AI joint venture and those relating to the sale of Renk.
At the end of the reporting year, the Automotive Division’s equity amounted to €96.7 billion, 4.3% more than a year earlier. The increase was mainly attributable to the profit generated, the hybrid notes issued in June 2020, and the positive effects from the measurement of derivatives recognized directly in equity. Currency translation, the dividend payment to the shareholders of Volkswagen AG resolved by the Annual General Meeting, and higher actuarial losses from the remeasurement of pension plans reduced equity. Noncontrolling interests are primarily held by the noncontrolling interest shareholders of TRATON. The equity ratio was 38.1 (37.6)%.
Noncurrent liabilities increased by €2.7 billion to €93.5 billion. The decrease in noncurrent financial liabilities included in this item was driven primarily by reclassifications from noncurrent to current liabilities to reflect shorter remaining maturities and by exchange rate effects; the issuance of green bonds in September 2020 had an offsetting impact on this item. Pension provisions were significantly higher than the comparative 2019 figure, due mainly to the actuarial remeasurement following a change in the discount rate.
At €63.8 (63.2) billion, current liabilities were on a level with the previous year. Current financial liabilities amounted to €−2.8 (−7.3) billion due primarily to reclassifications from noncurrent to current liabilities. The figures for the Automotive Division also contain the elimination of intragroup transactions between the Automotive and Financial Services divisions. As the current financial liabilities for the primary Automotive Division were lower than the loans granted to the Financial Services Division, a negative amount was disclosed in both periods. Current other liabilities were down, primarily due to the effects of the measurement of derivatives and to lower liabilities from buyback transactions. Other provisions decreased, due mainly to utilizations in connection with the diesel issue.
At the end of fiscal year 2020, the Automotive Division’s total assets amounted to €254.1 billion, up 2.9% compared with the figure on December 31, 2019.
CONSOLIDATED BALANCE SHEET BY DIVISION AS OF DECEMBER 31 |
||||||||||||||
|---|---|---|---|---|---|---|---|---|---|---|---|---|---|---|
|
VOLKSWAGEN GROUP |
AUTOMOTIVE1 |
FINANCIAL SERVICES |
|||||||||||
€ million |
2020 |
2019 |
2020 |
2019 |
2020 |
2019 |
||||||||
|
||||||||||||||
|
|
|
|
|
|
|
||||||||
Assets |
|
|
|
|
|
|
||||||||
Noncurrent assets |
302,170 |
300,608 |
156,861 |
153,736 |
145,309 |
146,873 |
||||||||
Intangible assets |
67,968 |
66,214 |
67,781 |
66,010 |
187 |
204 |
||||||||
Property, plant and equipment |
63,884 |
66,152 |
62,807 |
65,043 |
1,077 |
1,110 |
||||||||
Lease assets |
50,686 |
48,938 |
1,512 |
2,084 |
49,174 |
46,853 |
||||||||
Financial services receivables |
82,565 |
86,973 |
−377 |
−390 |
82,942 |
87,363 |
||||||||
Investments, equity-accounted investments and other equity investments, other receivables and financial assets |
37,067 |
32,331 |
25,137 |
20,989 |
11,930 |
11,342 |
||||||||
Current assets |
194,944 |
187,463 |
97,236 |
93,081 |
97,708 |
94,382 |
||||||||
Inventories |
43,823 |
46,742 |
39,055 |
41,898 |
4,768 |
4,844 |
||||||||
Financial services receivables |
58,006 |
58,615 |
−557 |
−640 |
58,562 |
59,255 |
||||||||
Other receivables and financial assets |
38,044 |
38,620 |
17,012 |
17,803 |
21,033 |
20,817 |
||||||||
Marketable securities |
21,162 |
16,769 |
17,503 |
13,546 |
3,658 |
3,223 |
||||||||
Cash, cash equivalents and time deposits |
33,909 |
25,923 |
24,222 |
19,679 |
9,687 |
6,243 |
||||||||
Assets held for sale |
– |
795 |
– |
795 |
– |
– |
||||||||
Total assets |
497,114 |
488,071 |
254,097 |
246,816 |
243,017 |
241,255 |
||||||||
|
|
|
|
|
|
|
||||||||
Equity and liabilities |
|
|
|
|
|
|
||||||||
Equity |
128,783 |
123,651 |
96,733 |
92,774 |
32,050 |
30,877 |
||||||||
Equity attributable to Volkswagen AG shareholders |
111,336 |
109,117 |
79,913 |
78,872 |
31,423 |
30,246 |
||||||||
Equity attributable to Volkswagen AG hybrid capital investors |
15,713 |
12,663 |
15,713 |
12,663 |
– |
– |
||||||||
Equity attributable to Volkswagen AG shareholders and hybrid capital investors |
127,049 |
121,781 |
95,626 |
91,535 |
31,423 |
30,246 |
||||||||
Noncontrolling interests |
1,734 |
1,870 |
1,107 |
1,239 |
627 |
631 |
||||||||
Noncurrent liabilities |
202,921 |
196,497 |
93,523 |
90,822 |
109,398 |
105,675 |
||||||||
Financial liabilities |
114,809 |
113,556 |
15,637 |
17,592 |
99,173 |
95,965 |
||||||||
Provisions for pensions |
45,081 |
41,389 |
44,207 |
40,631 |
874 |
759 |
||||||||
Other liabilities |
43,031 |
41,551 |
33,680 |
32,600 |
9,352 |
8,951 |
||||||||
Current liabilities |
165,410 |
167,924 |
63,840 |
63,220 |
101,569 |
104,703 |
||||||||
Financial liabilities |
88,648 |
87,912 |
−2,806 |
−7,312 |
91,454 |
95,224 |
||||||||
Trade payables |
22,677 |
22,745 |
19,539 |
19,603 |
3,137 |
3,142 |
||||||||
Other liabilities |
54,085 |
56,896 |
47,107 |
50,559 |
6,978 |
6,337 |
||||||||
Liabilities associated with assets held for sale |
– |
370 |
– |
370 |
– |
– |
||||||||
Total equity and liabilities |
497,114 |
488,071 |
254,097 |
246,816 |
243,017 |
241,255 |
||||||||
At the end of 2020, intangible assets in the Passenger Cars Business Area were higher than at the 2019 balance sheet date. This was attributable among other factors to an increase in capitalized development costs. Exchange rate factors and depreciation in excess of additions led to a decrease in property, plant and equipment. Equity-accounted investments rose compared with December 31, 2019: the year-on-year decline in the business results of the Chinese joint ventures was set against resolutions to pay lower dividends in the Chinese joint ventures, as well as additions to the interests held in entities such as Argo AI, QuantumScape, Anhui Jianghuai Automobile Group Holdings and Northvolt. Overall, noncurrent assets increased by 3.0% compared with the end of 2019. Current assets rose by 10.2%. The inventories included in this item were lower as a result of downscaled production in response to the pandemic and due to exchange rate effects. Total securities and cash and cash equivalents in the Passenger Cars Business Area significantly exceeded the figure recorded at the end of 2019. On December 31, 2020, the Passenger Cars Business Area had total assets amounting to €213.4 (201.8) billion.
At €81.4 (75.8) billion, the Passenger Cars Business Area’s equity was up on the figure for December 31, 2019, mainly for earnings-related reasons. Total noncurrent liabilities were 4.6% higher than at the end of 2019. The noncurrent financial liabilities included in this item increased, and pension provisions rose, mainly due to the actuarial remeasurement following a change in the discount rate. A rise in current financial liabilities was the main factor driving the 4.9% increase in current liabilities compared with the end of 2019. This was offset in particular by lower other provisions, whose decline was driven by factors such as utilizations in connection with the diesel issue.
PASSENGER CARS BUSINESS AREA BALANCE SHEET STRUCTURE |
||||
|---|---|---|---|---|
€ million |
Dec. 31, 2020 |
Dec. 31, 2019 |
||
|
|
|
||
Noncurrent assets |
130,237 |
126,387 |
||
Current assets |
83,180 |
75,459 |
||
Total assets |
213,417 |
201,846 |
||
Equity |
81,423 |
75,773 |
||
Noncurrent liabilities |
82,263 |
78,679 |
||
Current liabilities |
49,731 |
47,394 |
||
At the end of the reporting period, property, plant and equipment in the Commercial Vehicles Business Area was up slightly, while lease assets were down. In total, noncurrent assets were slightly lower than at the last balance sheet date in 2019, amounting to €24.8 (25.1) billion. Current assets declined by 16.1%. The inventories included in this item were lower as a result of downscaled production in response to the pandemic. Total securities and cash and cash equivalents decreased in the reporting year. At €36.0 billion, total assets were again €2.5 billion lower than in the previous year.
The Commercial Vehicles Business Area’s equity was down on the previous year, amounting to €13.4 (14.1) billion. Noncurrent liabilities were 6.8% lower overall than on December 31, 2019. There was a decline in other noncurrent liabilities. Current liabilities dropped by a total of 7.9%. The current other liabilities included in this item were lower than on the previous year’s balance sheet date.
COMMERCIAL VEHICLES BUSINESS AREA BALANCE SHEET STRUCTURE |
||||
|---|---|---|---|---|
€ million |
Dec. 31, 2020 |
Dec. 31, 2019 |
||
|
|
|
||
Noncurrent assets |
24,777 |
25,143 |
||
Current assets |
11,256 |
13,420 |
||
Total assets |
36,033 |
38,563 |
||
Equity |
13,389 |
14,115 |
||
Noncurrent liabilities |
10,592 |
11,367 |
||
Current liabilities |
12,052 |
13,081 |
||
The Power Engineering Business Area’s intangible assets and property, plant and equipment were lower on December 31, 2020 than on the prior-year balance sheet date. Noncurrent assets dropped by a total of 16.3%. Current assets decreased by 33.4%, with a significant reduction in the cash and cash equivalents included in this item. In the previous year, the “Assets held for sale” item had included the carrying amounts of assets derecognized as a result of the sale of Renk completed in October 2020. As a result, total assets in the Power Engineering Business Area went down to €4.6 (6.4) billion at the end of fiscal year 2020.
At the end of 2020, the Power Engineering Business Area’s equity amounted to €1.9 (2.9) billion. Overall, noncurrent liabilities were lower than a year earlier. Current liabilities also declined compared with the end of 2019. The financial liabilities included here fell significantly, while other provisions went up because of provisions recognized for restructuring measures. Current liabilities as of the end of 2019 had also included the carrying amounts of the liabilities of Renk, which were derecognized as a result of the sale of Renk in 2020.
POWER ENGINEERING BUSINESS AREA BALANCE SHEET STRUCTURE |
||||
|---|---|---|---|---|
€ million |
Dec. 31, 2020 |
Dec. 31, 2019 |
||
|
|
|
||
Noncurrent assets |
1,847 |
2,206 |
||
Current assets |
2,800 |
4,202 |
||
Total assets |
4,647 |
6,408 |
||
Equity |
1,922 |
2,885 |
||
Noncurrent liabilities |
668 |
777 |
||
Current liabilities |
2,057 |
2,746 |
||
Financial Services Division balance sheet structure
On December 31, 2020, the Financial Services Division had total assets of €243.0 (241.3) billion, slightly more than at the balance sheet date in 2019.
Noncurrent assets declined by 1.1% to €145.3 billion compared with the end of the prior year; the property, plant and equipment included in this item was virtually unchanged. Lease assets increased, while non-current financial services receivables were down because volumes and exchange rates were affected by the Covid-19 pandemic.
Current assets expanded to €97.7 (94.4) billion. Current financial services receivables were lower than at the end of 2019, primarily for pandemic-related reasons. At €13.3 billion, total securities and cash and cash equivalents in the Financial Services Division exceeded the figure recorded at the end of 2019 by €3.9 billion.
On December 31, 2020, the Financial Services Division accounted for around 48.9 (49.4)% of the Volkswagen Group’s assets.
At the end of the reporting year, the Financial Services Division’s equity stood at €32.0 billion, 3.8% more than a year earlier. Negative exchange rate effects were offset by positive earnings. The equity ratio was 13.2 (12.8)%.
Noncurrent liabilities increased by 3.5% overall, mainly due to a rise in noncurrent financial liabilities and higher other provisions. A reduction in current financial liabilities, offset by higher other current liabilities, led to a net decrease in total current liabilities.
Deposits from the direct banking business amounted to €28.9 (32.5) billion, and were therefore below the figure recorded at the end of 2019.